

- Product details
Energy consumption and carbon emission monitoring and management system based on the latest Internet of things technology, through collecting energy consumption data of various energy consumption monitoring points, through professional data analysis and processing, to achieve a comprehensive visualization of energy use. For users to establish a complete set of energy management system, such as energy prediction, planning, assessment, and so on, to help enterprises continue to optimize the use of energy, reduce the comprehensive energy consumption of users.
System function
Provide real-time power monitoring, power quality monitoring, real-time accident alarm, and report statistics management
Energy management comprehensive energy monitoring, energy consumption trend analysis, energy consumption report management, and abnormal energy consumption diagnosis
Asset operation and maintenance management, equipments information management, device fault reporting, scheduled task management, work order flow execution, task scheduling management, and work order status tracking
Energy consumption and carbon emission monitoring and management system application basic functions
◎ Energy data acquisition
Support mainstream communication protocols and various communication interfaces, support wired/wireless
◎ Statistics with energy data
Automatic statistics of hour/day/month/year all kinds of energy data
◎ The report of energy use
Daily/monthly/annual report based on Excel
◎ Energy use warning
It can set alarm thresholds for safety connection and energy use, sound and light, SMS and APP alarm
◎ The power quality
Frequency and voltage fluctuation; Three-phase unbalance; Harmonic; Provide power quality report
◎ Cost center
The energy expenditure of each region/department can be calculated on a daily/monthly/annual basis
◎ Program performance
Formulate energy use plan and support energy use performance assessment
◎ Multidimensional energy analysis
Proportion analysis, category/item/block/group analysis, energy ranking
Features of energy consumption management application system
◎ Support any period of the same, ring, proportion, ranking analysis, energy points and outliers at a glance;
◎ Support comprehensive energy consumption statistics at any time period, the proportion and trend of the consumption of various energy media can be clearly seen;
◎ Make comprehensive energy efficiency analysis of key energy using equipment such as motor and boiler, guide the adjustment of equipment operation mode and technical transformation;
◎ Through monitoring and analysis of energy inlet and outlet, timely detection of water, electricity and gas leakage, to avoid waste;
◎ The system has built-in 30+ Kanban templates, which can be freely configured and selected according to needs, greatly reducing the deployment time;
◎ Integrated power monitoring and dynamic ring monitoring functions, providing 24-hour remote real-time monitoring;
◎ Comprehensive monitoring objects (equipment, environment, data, etc.), and intelligent early warning (can be defined early warning rules and a variety of notification methods), the failure rate can be reduced by 80%;
◎ Remote monitoring, remote meter reading, eliminate security risks;
◎ Full event recording, running data minute-level recording, historical data can be played back, intelligent assisted analysis. The system automatically generates a report, and gives the electricity optimization adjustment suggestions, templates can be customized;
◎ According to the charging method of the power grid company, analyze the rationality of electricity consumption in real time, monitor the demand/prevent power penalty, and directly give operation suggestions and expected earnings, to ensure the lowest electricity cost under the same electricity consumption;
◎ Monitor harmonic and three-phase unbalance and other power quality problems, real-time alarm, and can be adjusted with the adjusting equipment;
◎ Harmonic visualization: extend equipment life and reduce loss through harmonic management; Three-phase unbalance: prolong the life of transformer by more than 8% and reduce line loss; Adjust power factor: avoid penalty for electricity;
◎ Integrate equipment ledger management, equipment operation data, equipment maintenance records, provide equipment life cycle management;
◎ Provide mobile APP: managers can master equipment status and energy consumption information in real time to improve the efficiency of operation and maintenance personnel;
◎ Based on SOA open architecture, it is convenient to integrate third-party monitoring systems such as refrigeration, new energy, elevator, process control and environmental monitoring.

 Back
Back
-
Smart emergency big data platform
Emergency safety platform

-
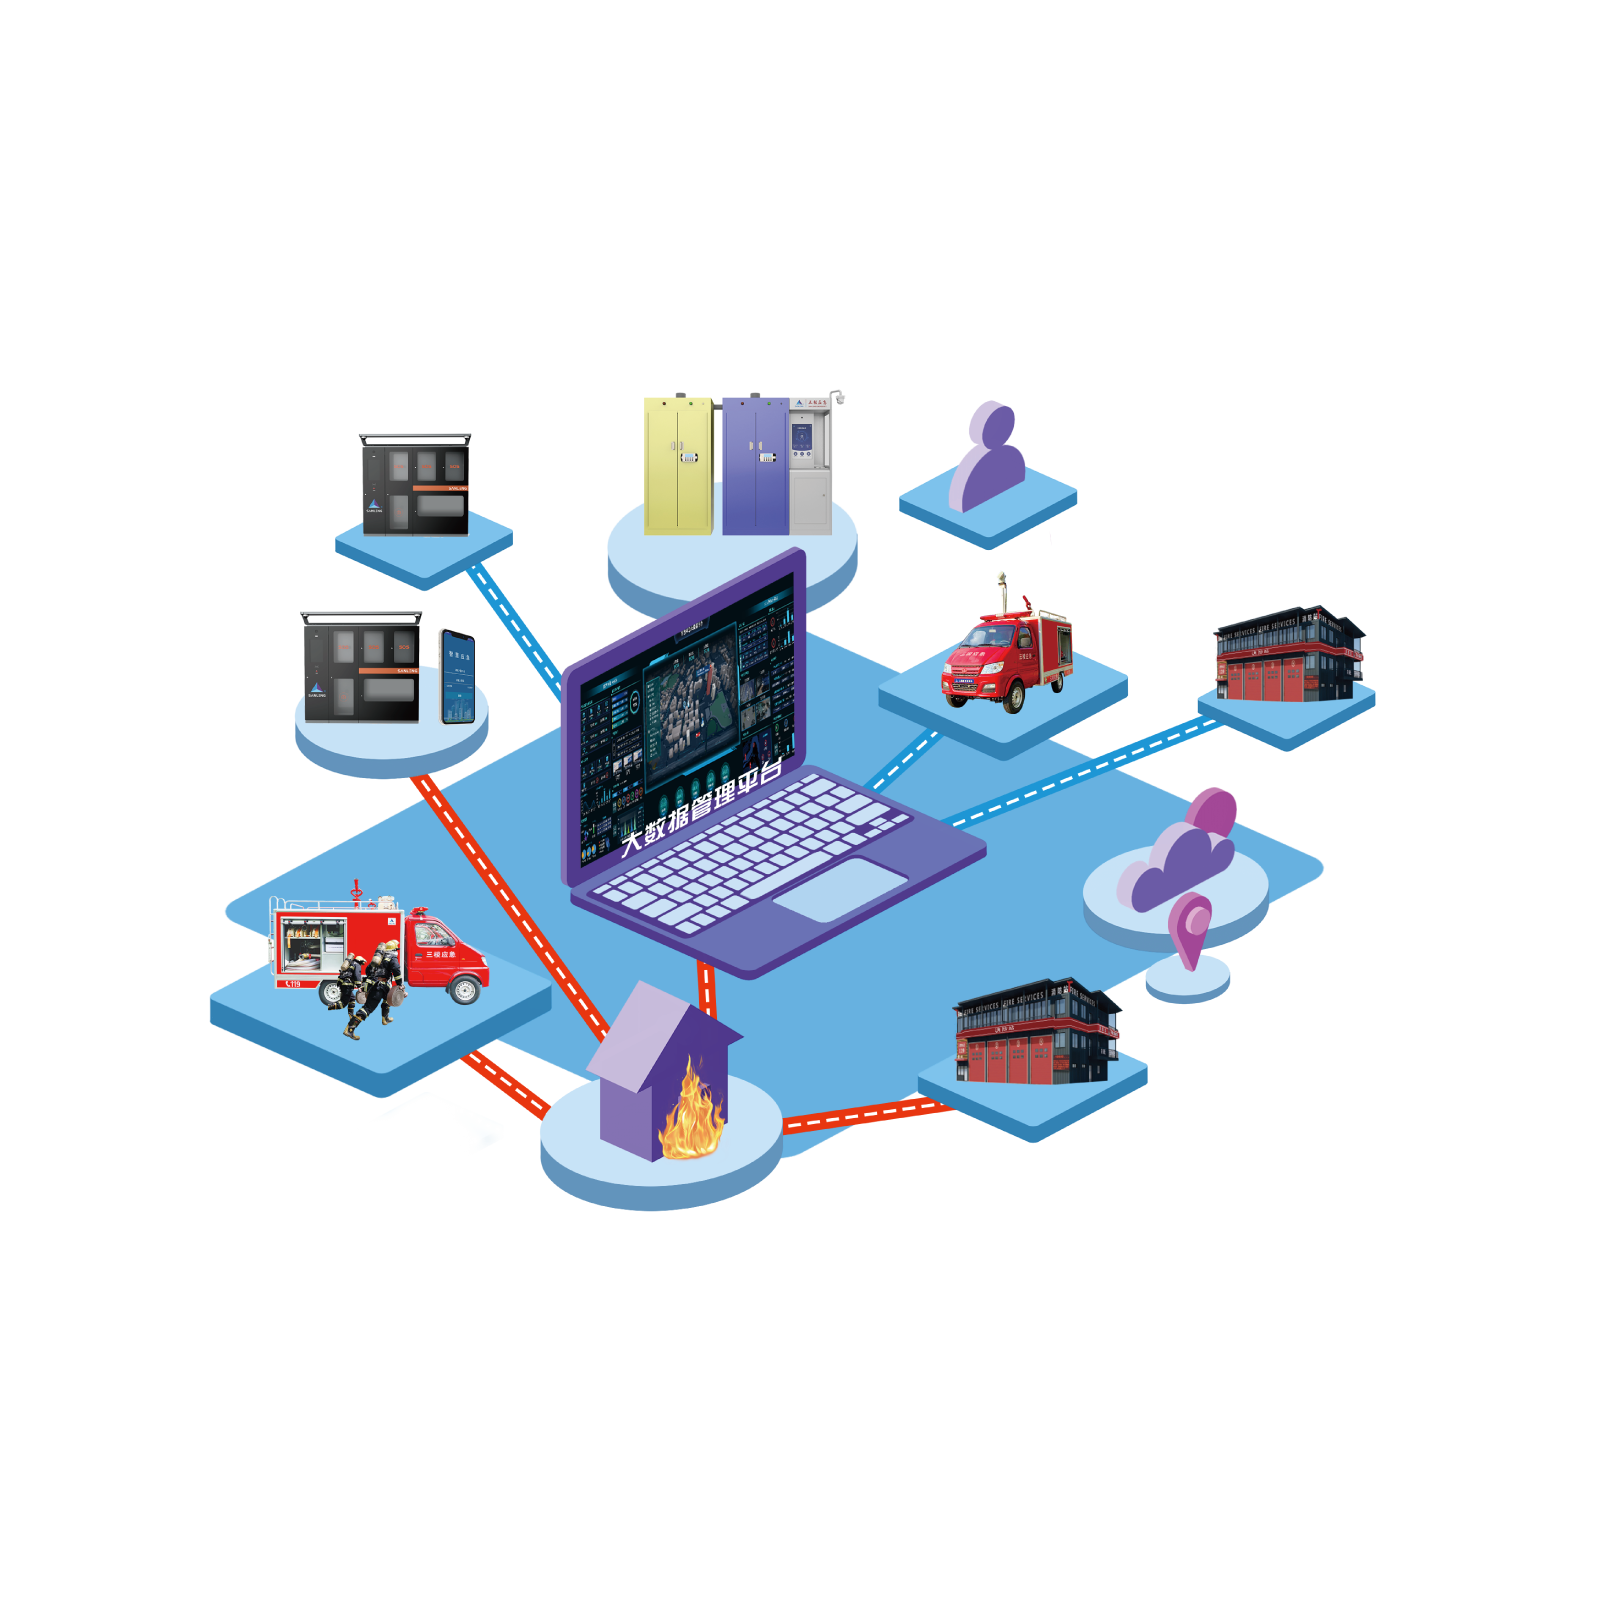
Intelligent fire big data platform
Emergency safety platform
-
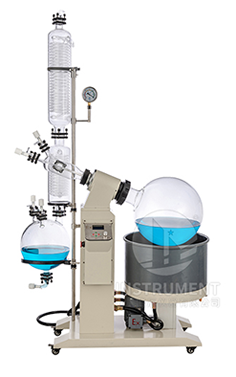
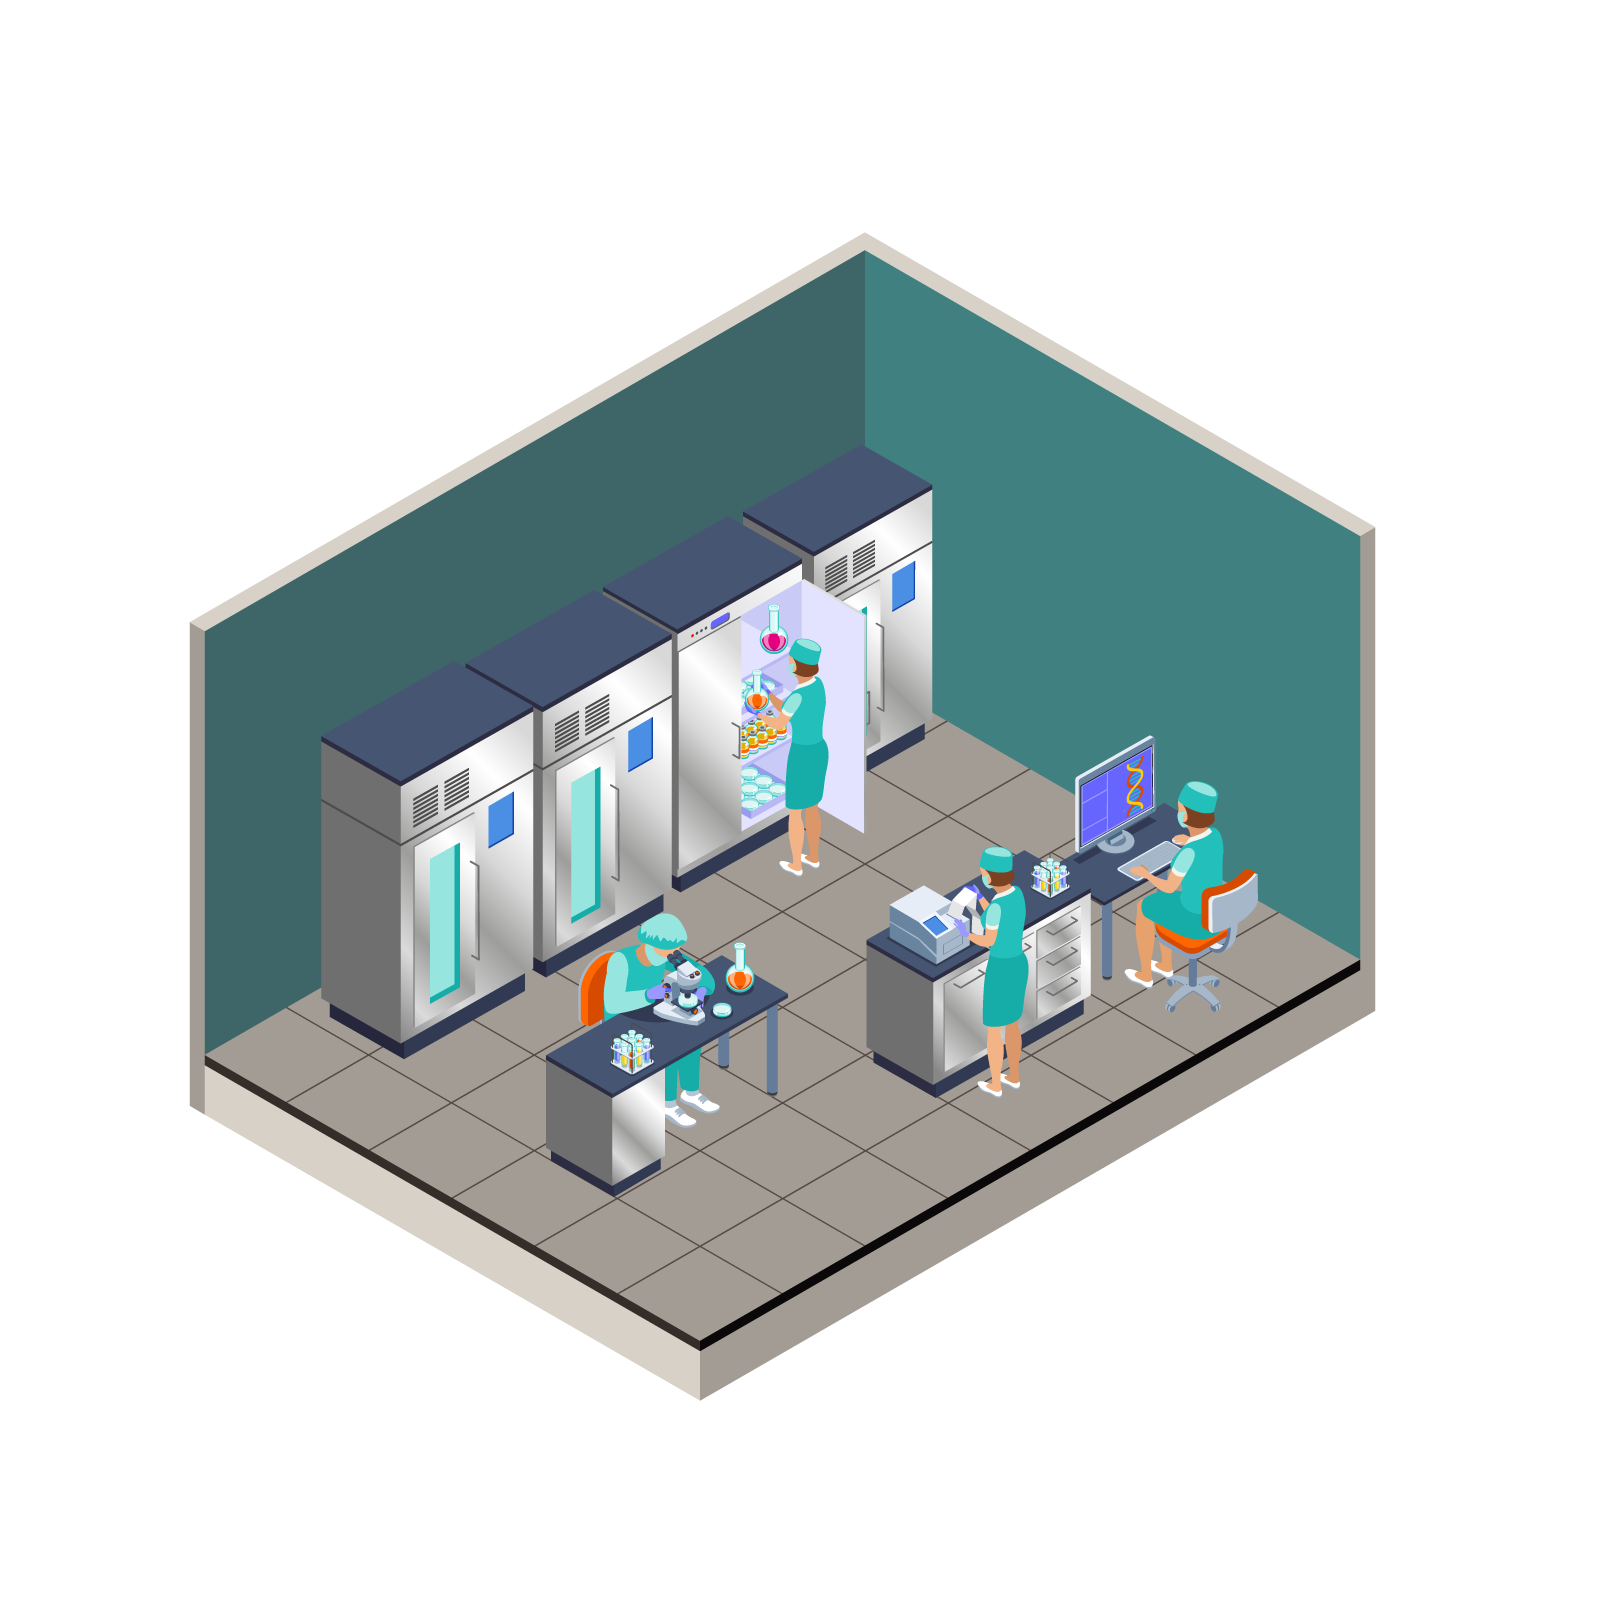
Visual laboratory integrated management system
Emergency safety platform
-
Chemical industrial park safety monitoring and early warning system
Emergency safety platform